


Meta-analysis is a powerful analysis method that calculates a general effect size by bringing together the statistical findings of numerous independent scientific studies according to specific criteria. It is an analysis method that statistically combines quantitative data from multiple studies. In this way, stronger, more reliable and more generalizable results are achieved beyond individual studies. This method, which is used in many fields from clinical trials to educational research, is preferred to synthesize scientific evidence and shed light on decision-making processes.
What distinguishes it from other analysis types is that it works not with individual data but with statistical outputs of published studies. For this reason, meta-analysis both creates a higher impact in academic publications and systematically makes sense of the pile of information in the literature.
This page introduces the main stages of the method. Applied consulting is available for researchers who want guidance on search strategy, data extraction plans, model selection, and understanding the limits of their own outputs.
Service boundary: Literature selection, academic assessment, interpretation, and the final text remain the researcher’s responsibility. Consulting does not include preparing a thesis, article, or publication-ready report on behalf of a researcher.
What is Meta-Analysis?
Meta-analysis is usually mentioned together with systematic review. However, these two methods serve different purposes:
- Systematic review scans the literature according to specific criteria, summarizes the contents of studies and offers a qualitative interpretation.
- Meta-analysis produces a numerical general result by bringing together the statistical results (effect sizes) of these studies.
Example: You systematically scan and summarize 30 studies examining the relationship between teachers' digital literacy and student achievement (systematic review). However, if you calculate a general correlation coefficient from their statistical outputs, this is a meta-analysis.
Inclusion and Exclusion Criteria
Inclusion and exclusion criteria guide the determination of studies to be used in the analysis. These criteria may include:
- Publication Language and Date: For example, only studies published after 2015 and in English or Turkish.
- Participant Characteristics: Specific age range, occupational group or education level.
- Research Method: Experimental, quasi-experimental, correlational, etc.
- Data Type: Studies reporting numerical results are included, while those containing only interview data may be excluded.
Predetermining these criteria increases the homogeneity of selected studies and analysis reliability.
Meta-Analysis Interpretation Techniques
Correct interpretation of meta-analysis results is of great importance in terms of determining the reliability and scientific contribution of the findings obtained. The graphics and statistical measures used for this purpose not only present numerical data, but also provide strong clues about the quality and generalizability of the study.
1. Forest Plot
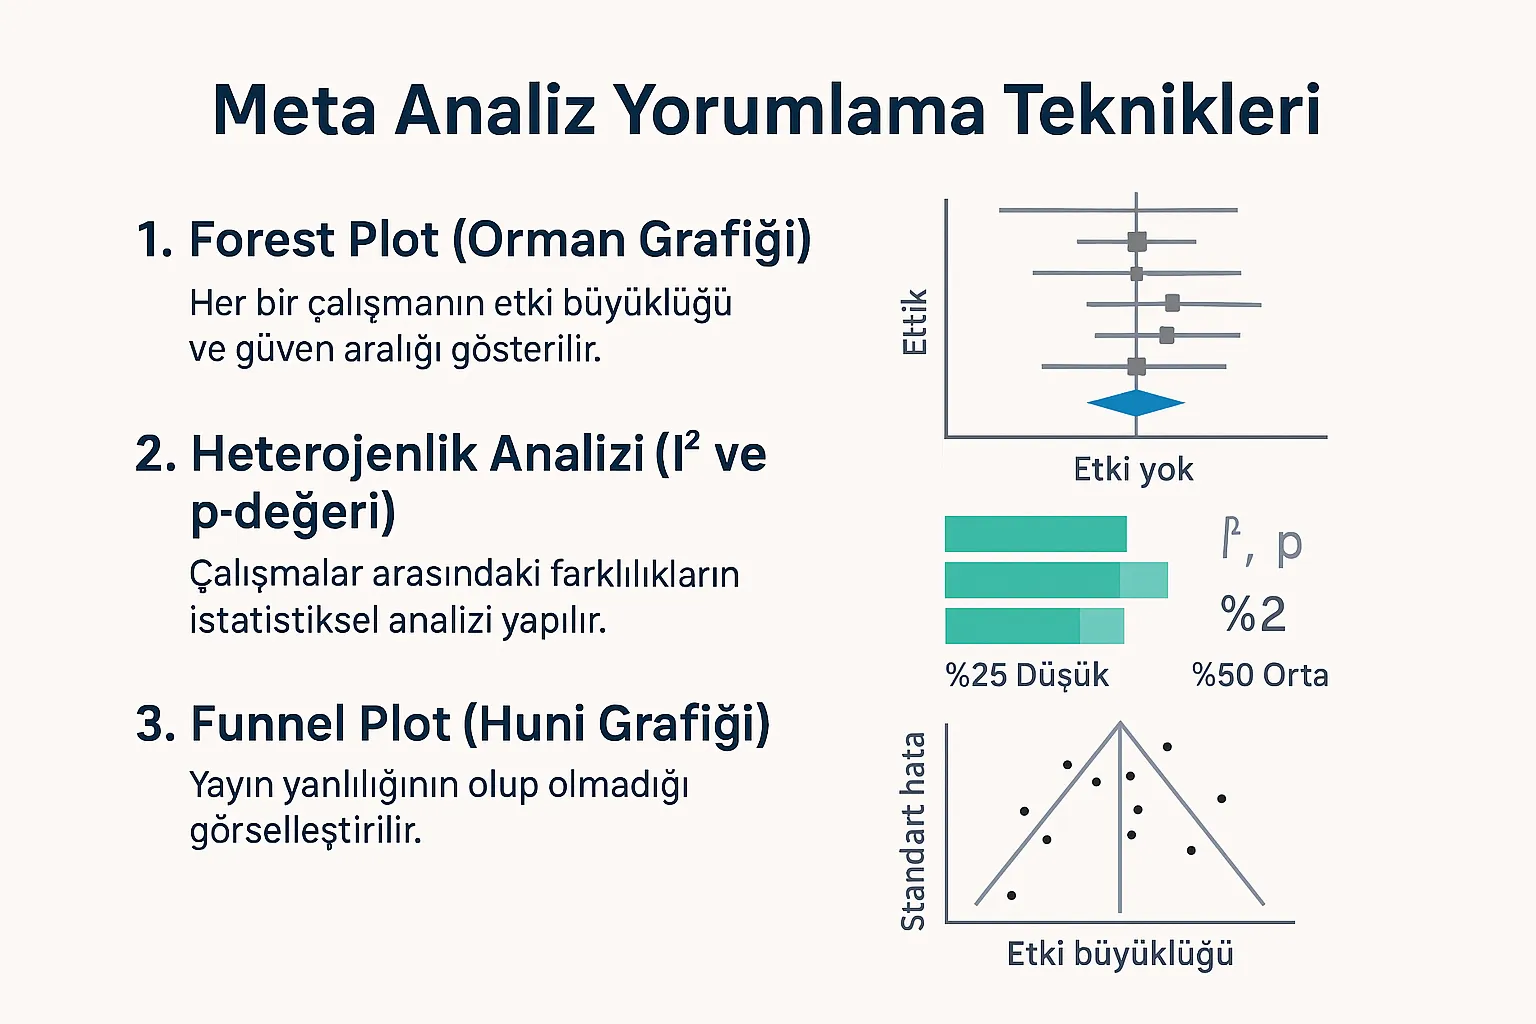
Forest plot is the basic visualization tool in meta-analysis. The effect size and confidence interval of each study is shown with a horizontal line. This graph:
- Clearly shows which studies reported larger or smaller effects,
- The width of confidence intervals,
- The direction of the general effect.
The center line in the graph generally represents the "no effect" boundary (e.g., d = 0). The overall effect size is summarized by the diamond figure at the bottom. This graph provides readers of the study with a quick and clear overview.
2. Heterogeneity Analysis (I² and p-value)
Heterogeneity shows how much difference there is between the results of the studies included in the analysis. It is used to understand whether these differences are random or systematic:
-
I² value: It is the percentage expression of the difference between studies. A high I² value indicates that the results are very different from each other.
- 25%: Low heterogeneity
- 50%: Medium level
- 75%+: High heterogeneity
-
Q test p-value: Tests whether heterogeneity is statistically significant.
These values are determinative when deciding whether to use a fixed effect model or a random effect model.
3. Funnel Plot
Funnel plot is used to check publication bias in meta-analysis. Especially more frequent publication of positive results can disrupt the balance in the literature. This graph:
- Reveals possible imbalances by showing study sample sizes and effect sizes on two axes.
- Symmetrical structure → no publication bias
- Asymmetrical structure → publication bias is possible
When detailed analysis is needed, advanced methods such as Egger's test and Duval & Tweedie are also used. If publication bias is detected, the reliability of the results can be questioned, so funnel plot is quite critical.
- Used to test whether there is publication bias.
- Symmetrical funnel: Low publication bias.
- Asymmetry: Probably positive results were published more.
If necessary, publication bias can be evaluated in more detail with Egger's test and Duval & Tweedie trim-and-fill method.
Meta-Analysis Study Example
For example, suppose a meta-analysis study was conducted on "the effect of digital game-based learning methods on academic achievement". In this study, the following steps are followed:
-
Literature Review: Publications are scanned with specified keywords (e.g. "digital game-based learning", "academic achievement") in databases such as Scopus, Web of Science, ERIC.
-
Inclusion Criteria: Only experimental studies, specific age groups and studies conducted with specific measurement tools are included.
-
Data Set: 20 studies meeting the specified criteria are selected.
-
Effect Size Calculation: Effect size values such as Cohen's d or Hedges' g are extracted from each study.
-
Model Selection: Random effects model is preferred due to methodological and sample differences of studies.
-
Interpretation:
- Overall effect size is visualized with forest plot (example: d = 0.48 [0.35, 0.60], medium level effect).
- I² value 42% → medium level heterogeneity.
- Funnel plot symmetrical → low risk of publication bias.
By interpreting these results, the following inferences can be made in the meta-analysis study:
- Digital game-based learning methods have a positive and significant effect on academic achievement.
- Publication bias or methodological diversity is limited.
- These results can be taken into account in policies and practices related to educational technologies.
How to Write a Meta-Analysis?
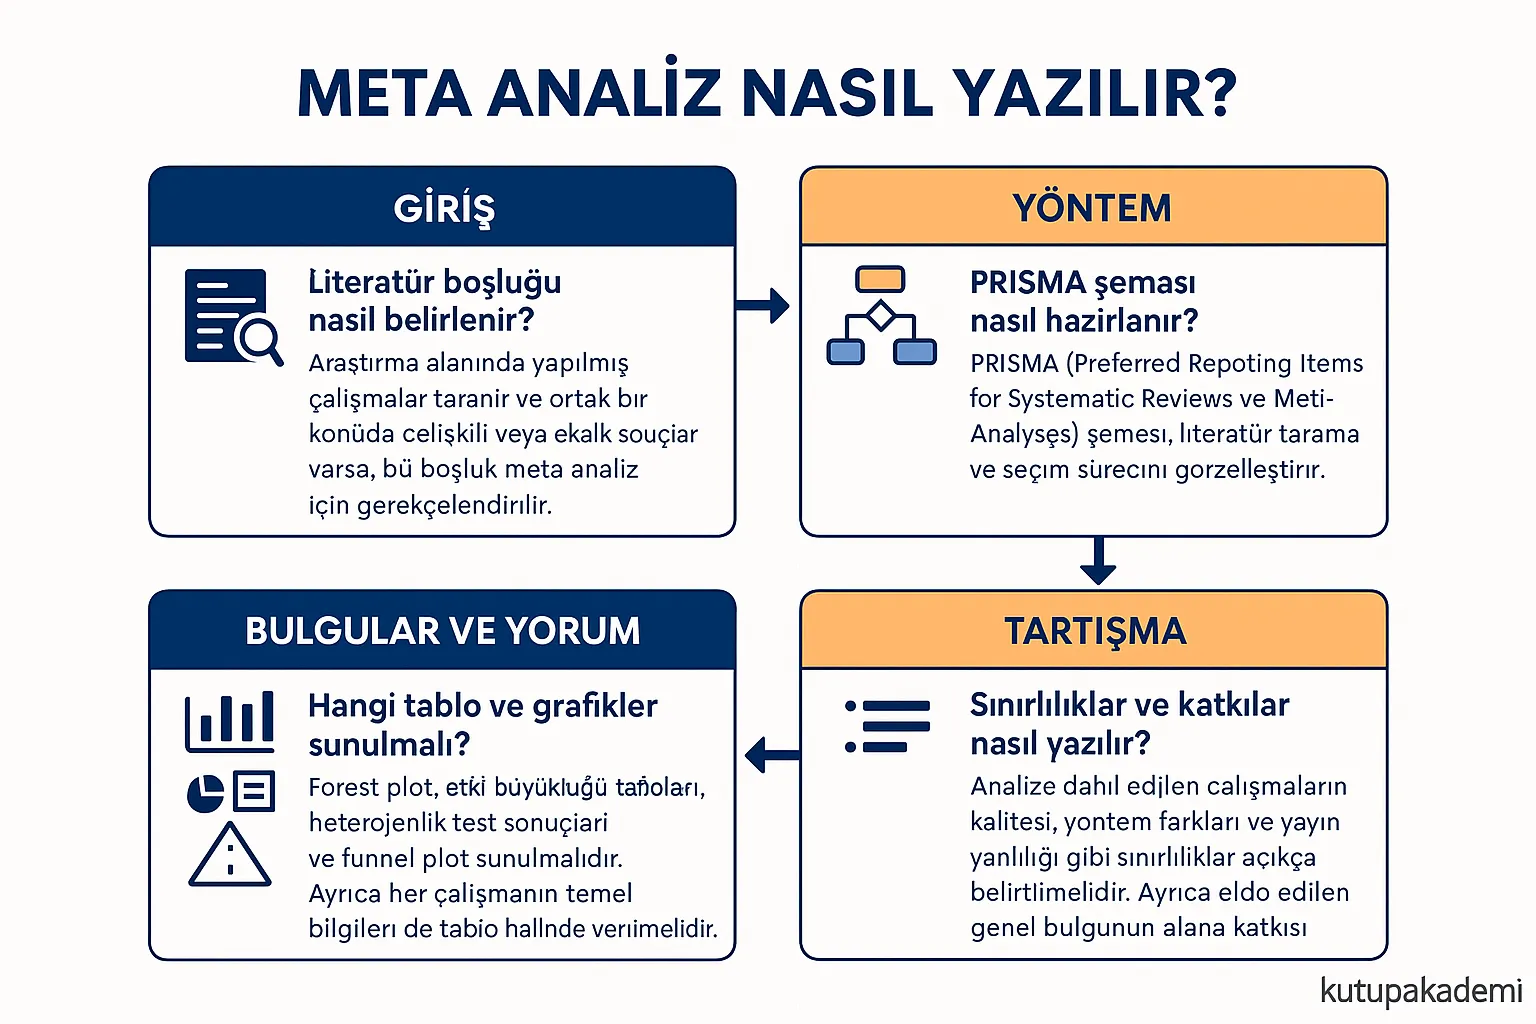
Introduction – How to determine the literature gap?
Studies conducted in the research area are scanned and if there are conflicting or incomplete results on a common topic, this gap is justified for meta-analysis.
Method – How to prepare a PRISMA diagram?
The PRISMA (Preferred Reporting Items for Systematic Reviews and Meta-Analyses) diagram visualizes the literature scanning and selection process. The diagram shows how many studies were found, how many were eliminated and why they were eliminated.
Findings and Interpretation – Which tables and graphs should be presented?
Forest plot, effect size tables, heterogeneity test results and funnel plot should be presented. In addition, basic information of each study should also be given in table form.
Discussion – How to write limitations and contributions?
Limitations such as quality of studies included in the analysis, methodological differences and publication bias should be clearly stated. In addition, the contribution of the general findings obtained to the field should be interpreted.
Scope of Meta-Analysis Consulting
Meta-analysis requires a protocol defined in advance and reported transparently. Consulting helps researchers learn this process and justify their own decisions.
Consulting can cover:
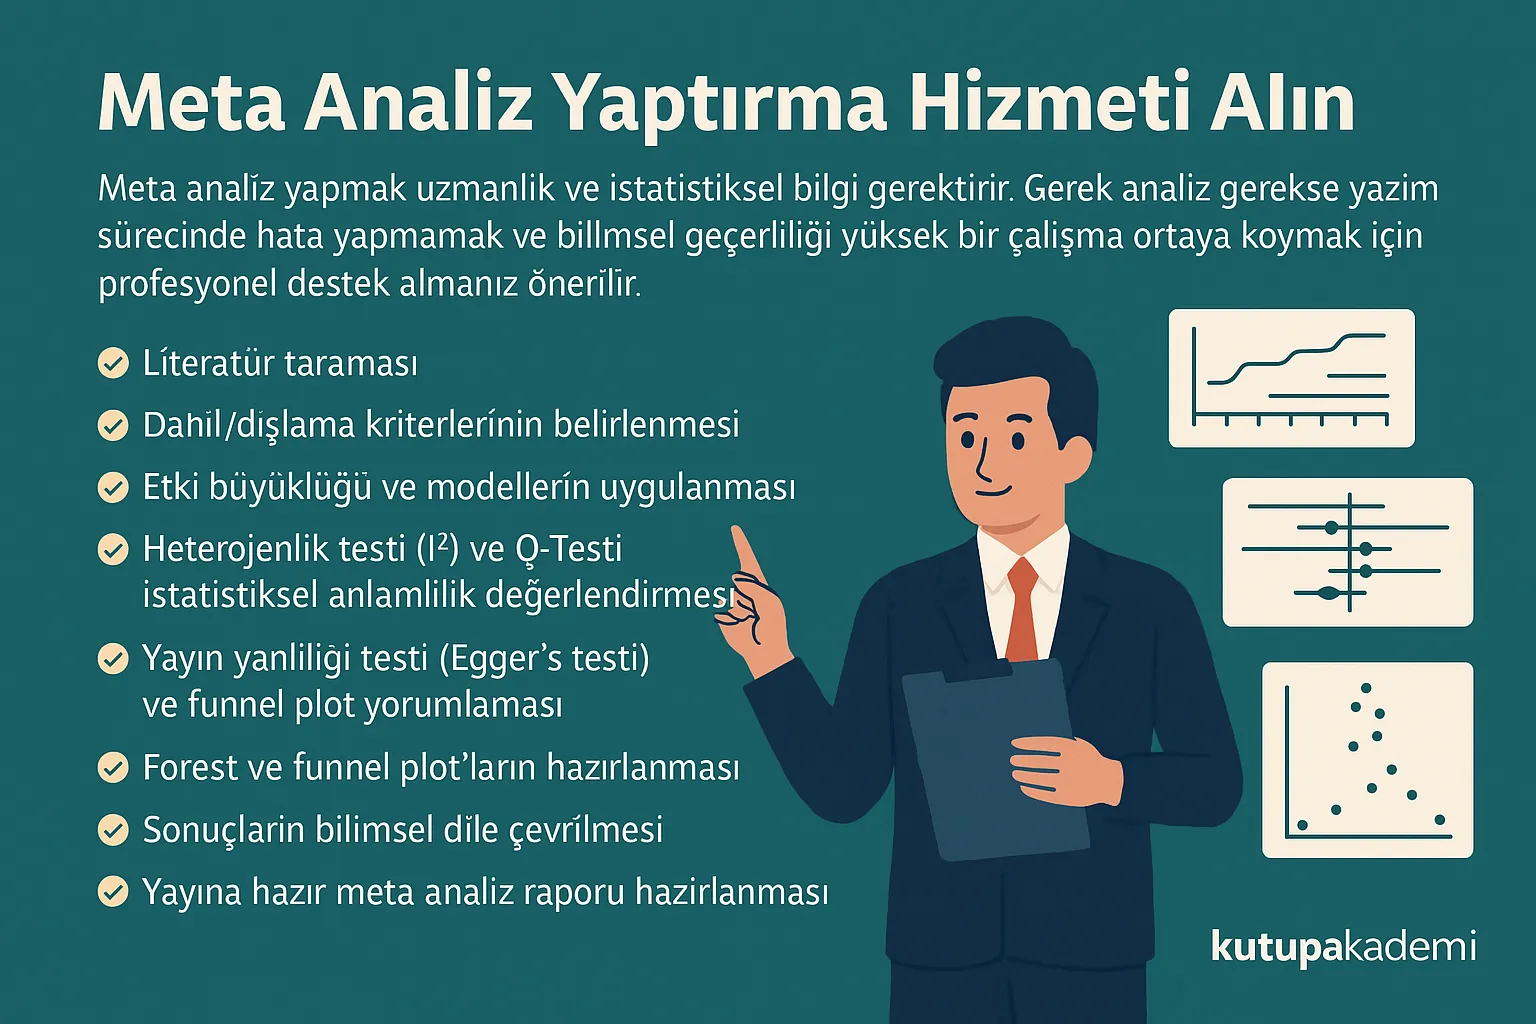
- Review of the researcher’s search strategy
- Assessment of consistency in inclusion and exclusion criteria
- Explanation of data-extraction forms and double-checking approaches
- Teaching assumptions behind effect sizes and model options
- Demonstrating how to read heterogeneity and publication-bias outputs
- Applied guidance for producing forest and funnel plots
- Feedback on the researcher’s own report against PRISMA and transparency criteria
we provide support.
You can reach us through the contact page for methodological guidance while conducting your own meta-analysis.