

Sample Size Calculation Analysis with G Power
Sample size calculation with G Power is the process of scientifically determining how many participants are needed in a statistical analysis. This calculation is essential for research results to be reliable and valid. Analyses conducted with too few participants may miss important differences, while working with more participants than necessary can lead to waste of time and resources. Therefore, especially in academic studies, determining the correct sample size is a fundamental requirement.
In the continuation of the page, you can find all the steps of the sample calculation process using GPower in detail, why this process is critical, and how it can be applied in which test types. If you also want to achieve reliable results with a correctly calculated sample, you can benefit from our GPower analysis service and carry out the process more healthily by taking advantage of the guidance offered by this page.
What is GPower Analysis?
Power analysis is a statistical method for calculating the probability of revealing a real effect in a planned research. The basic answer to the question "What is power analysis?" is to guarantee the statistical power of the study by determining the minimum number of participants needed. Especially in academic research, the correct determination of power level, sample size and alpha level is of critical importance to reach reliable results.
GPower is a software that has been developed for power analysis in statistical analyses and can be used free of charge. This software allows sample size calculation for various test types, while also enabling the assessment of analysis power in existing studies.
GPower can be used for most basic statistical tests such as t-test, ANOVA, regression analysis, chi-square tests. The researcher can perform the calculation by selecting the type of analysis to be performed and entering the test parameters. With this feature, it is accessible and easy to use even for users who do not have advanced statistical knowledge.
Especially in academic studies, it is very important to determine the scientific power of the study and to determine the minimum number of samples required for testing hypotheses. GPower is one of the most common and reliable software that meets this need.
Why is Sample Calculation with Power Analysis Necessary?
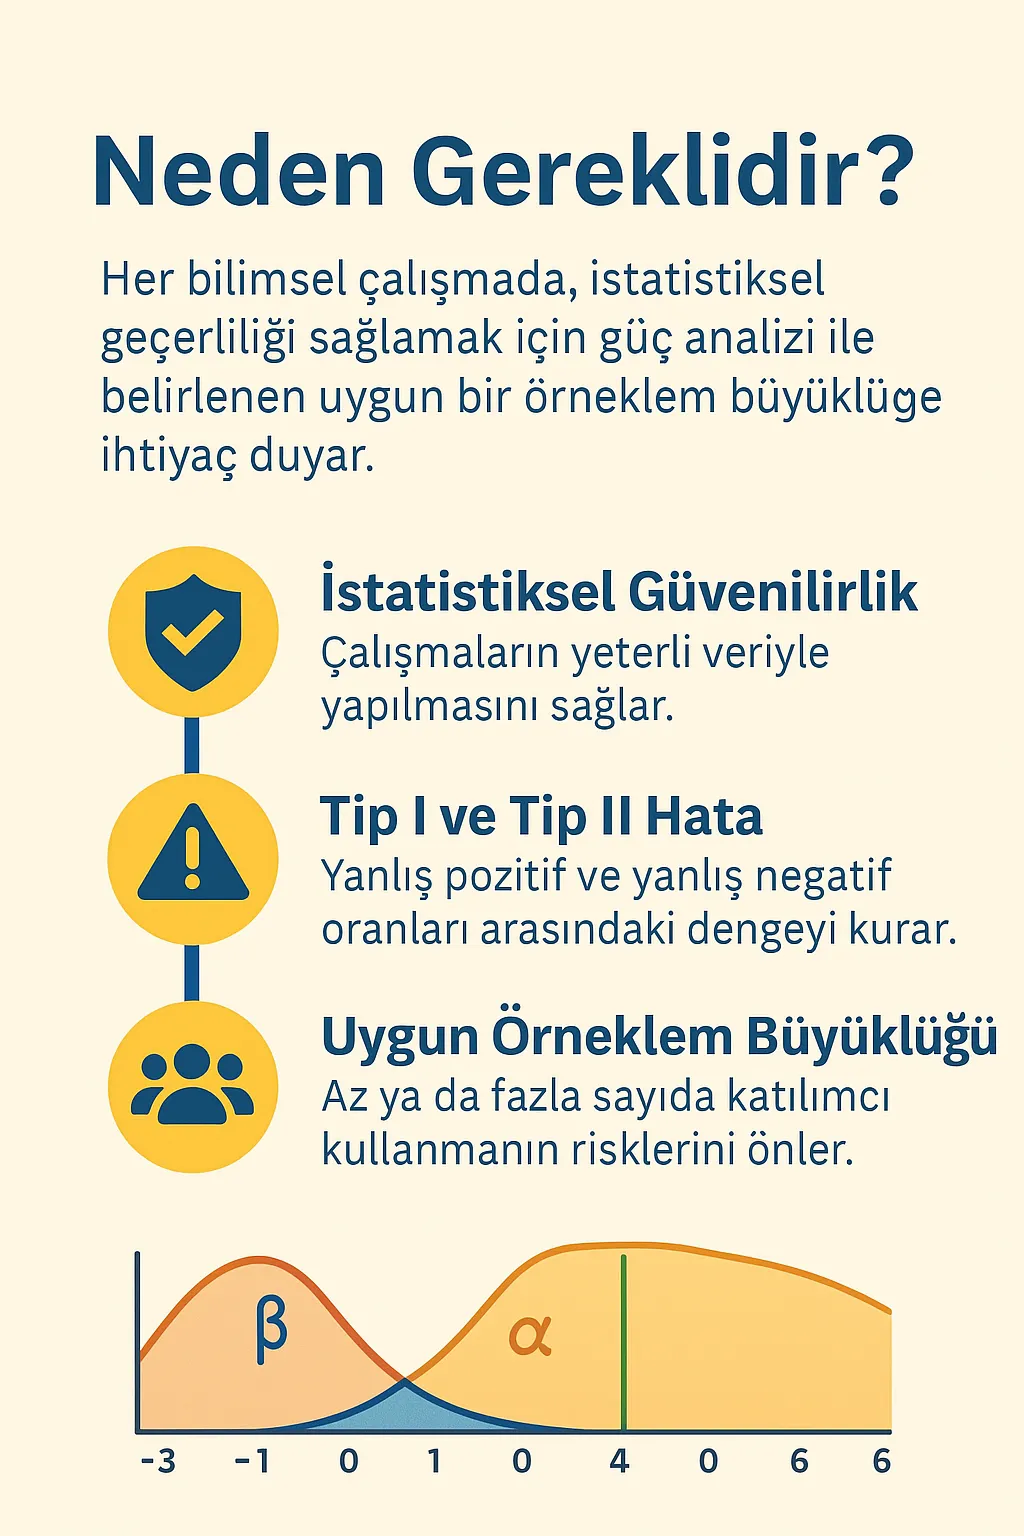
Every scientific study needs an appropriate number of participants to be valid and reliable. Power analysis is the tool for determining this requirement systematically and on numerical foundations.
Statistical reliability requires having enough data to understand whether a particular difference actually exists. Power analysis indicates how much data you need at minimum to obtain a measurable response. This provides savings in both time and resources.
It also increases the statistical significance of the analysis result by balancing Type I (false positive) and Type II (false negative) error rates. Studies conducted with less sample than necessary may not see significant differences, while excessive sample also leads to unnecessary resource expenditure.
How Does Power Analysis Help Calculate Sample Size?
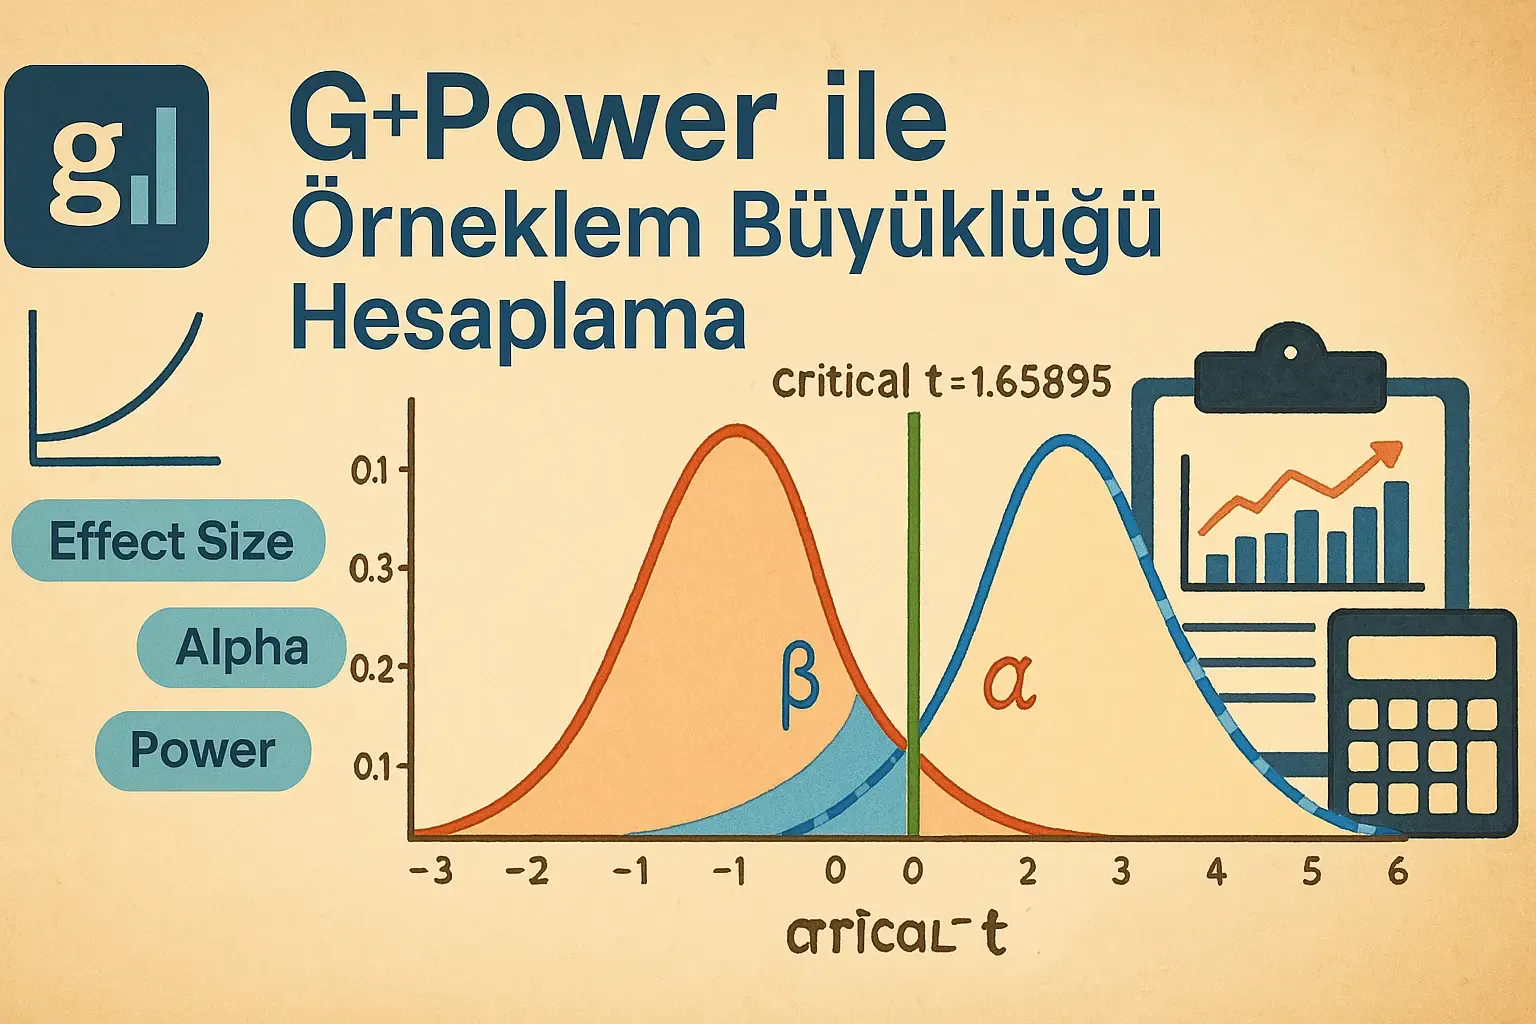
There are important concepts in power analysis: "effect size", "alpha level" and "power level". Effect size indicates the magnitude of the expected difference; alpha, the accepted error rate; power level indicates the probability of finding the real difference.
After these values are entered in GPower, the program calculates the number of samples based on these parameters. These values may vary depending on the selected test type and analysis method.
As a result, GPower presents the obtained calculations with tables and graphs. These outputs facilitate decision-making in research planning. Analyses performed with correct parameters form a valuable foundation both in terms of time and academic validity.
Table 1. Concepts and Meanings Used in G Power Power Analysis Sample Size Calculation
Concept
Definition
Recommended Threshold Value
Comment
Effect Size
Indicates the magnitude of the difference between two groups or variables. The greater the difference, the more pronounced the effect.
Small: 0.2, Medium: 0.5, Large: 0.8
0.2 is considered small, 0.5 medium, 0.8 large effect. Effect size contributes to the significance of the research.
Alpha Level (α)
The probability of mistakenly rejecting the H0 hypothesis in the research. Also known as Type I error rate.
Generally 0.05
A value of 0.05 indicates a 5% margin of error risk of obtaining a false positive result.
Power Level (Power)
The probability of correctly finding a real difference. Shows the power of not making a Type II error.
Generally ≥ 0.80
A power level of 0.80 means that a real effect can be found with 80% probability; preferred for reliable analyses.
So how is power analysis performed? During the analysis process, basic parameters such as effect size, alpha level, test direction and target power level are determined. GPower software automatically calculates the number of samples using these values and shows the statistical power level for the selected test type. This approach offers the researcher an important scientific advantage both in the planning phase and in the evaluation of the obtained results.
How to Perform Power Analysis with GPower? (Step by Step)
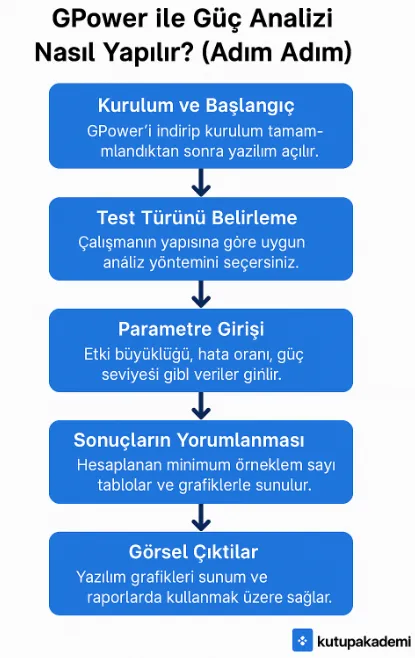
- Installation and Start: After downloading GPower from the official website and completing the installation, the software is opened. The main screen consists of multiple selection menus where you can select the analysis type.
- Determining the Test Type: You select the appropriate analysis method (t-test, ANOVA, regression, etc.) according to the structure of the study you will conduct. Making the right choice at this stage will determine the significance of the results.
- Parameter Entry: Data such as effect size, error rate (alpha), predetermined power level and analysis direction are entered. The software automatically performs calculations based on the entered information.
- Interpretation of Results: The calculated minimum sample size is presented together with tables and graphs. This information is used to interpret the statistical power of your study.
- Visual Outputs: The software can present analysis results graphically. These graphs are suitable for use in presentations and reports.
Advantages of Sample Size Calculation with G Power
One of the most preferred reasons for GPower is that it can be used without dealing with technical details. It offers an intuitive interface especially for researchers with limited statistical knowledge.
The calculation process is fast and provides reliable outputs. This is advantageous for a very wide user base from thesis level to publication level. It enables obtaining outputs that strengthen analysis reports, especially in project applications, ethics committee permissions and academic presentations.
In addition, by supporting different analysis types, it offers flexibility to users from various scientific disciplines. It is a user-friendly option for anyone who wants to receive comprehensive and customizable reports.
Power analysis eliminates the risk of missing significant results (Type II error) due to insufficient sample size or wasting resources due to unnecessarily large samples. For this reason, calculating sample size based on power analysis is one of the most reliable approaches in terms of the scientific validity of the research. GPower is widely preferred by researchers as it presents this calculation quickly and accessibly.
For Which Tests Can Sample Be Calculated with GPower?
GPower responds to analysis needs in many different fields from social sciences to health sciences. The software supports sample size calculation for the following basic test types as well as correlation analyses:
- t-test: Used to test the difference between two groups. Independent or paired t-test analyses are supported.
- One-way ANOVA: Used to test mean differences between three or more groups.
- Chi-square test: Used in frequency-based data analyses. Important in sampling categorical data.
- Regression Analysis: Used to see the effect of independent variables on the dependent variable. Linear and non-linear models are supported.
- Correlation Test: Used to examine the relationship between two variables. Especially in Pearson or Spearman correlation analyses, the sample size needed to test the strength of the relationship can be easily calculated with GPower.
GPower has the ability to calculate samples, determine power value and report analysis results for all of these tests. It is commonly used especially in experimental designs and comparison-based studies.
Frequently Asked Questions (FAQ)
How to calculate sample size with G Power?
Sample size indicates the minimum number of participants required for the research to produce statistically significant results. This calculation is based on statistical parameters such as effect size, alpha level (margin of error) and power level. With tools like GPower, the sample size can be determined quickly and accurately by entering these values.
What is G Power effect size?
"Effect size" in GPower is a statistical measure that shows the magnitude of the difference between variables. For example, Cohen's d value of 0.2 means small, 0.5 medium, 0.8 large effect. This value plays a critical role in interpreting the significance of the analysis result.
What should the effect size be in power analysis?
The effect size to be used in power analysis varies according to the nature of the study, but commonly accepted values are: small effect = 0.2, medium effect = 0.5, large effect = 0.8. If there are similar studies in past literature, the effect size values they reported can be referenced.
How is power calculated?
Power (statistical power) is the probability that a study will detect a real difference and is generally targeted at 80% (0.80) or higher. In GPower, analysis power can be calculated by entering effect size, alpha level and sample size. High power value reduces the risk of false negative results.
Verify Your Sample Calculation with Professional Support
Although using GPower software may seem technically simple, choosing the right test, estimating effect size and adjusting error rates require expertise. Therefore, it is important to get professional support, especially in important academic studies such as publications or theses.
With consultancy service, not only calculation, but also interpretation of the obtained results, conversion to academic writing and preparation of presentation files when necessary can be provided. In this way, it becomes easier both to receive positive feedback from advisor opinions and to ensure scientific consistency.
Ready analysis outputs are presented to you together with tables and graphs. Whether you request only calculation or a comprehensive analysis report, we are with you with solutions suitable for your academic goals. You can reach us immediately by filling out the contact form or through our whatsapp line and get a price quote. For your other analysis assistance requests, you can visit our services page.
Quick Contact Line